Use the package pgfplotstable to read tables from .csv files automatically and add them to your document.
Syntax and usage of pgfplotstable
When writing papers, it is sometimes necessary to present a large amount of data in tables. Writing such tables in LaTeX by hand is a very time-consuming and error-prone task. To avoid this, we can simply import the data directly from .csv (comma-separated value) files. Programs such as Excel, OpenOffice Calc or even emacs org-mode can export data sheets as .csv files. LaTeX can not work with them directly, but we can use the following code, to generate tables from .csv files:
\documentclass{article}
\usepackage{booktabs} % For \toprule, \midrule and \bottomrule
\usepackage{siunitx} % Formats the units and values
\usepackage{pgfplotstable} % Generates table from .csv
% Setup siunitx:
\sisetup{
round-mode = places, % Rounds numbers
round-precision = 2, % to 2 places
}
\begin{document}
\begin{table}[h!]
\begin{center}
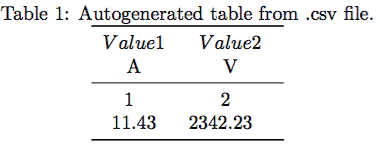
\caption{Autogenerated table from .csv file.}
\label{table1}
\pgfplotstabletypeset[
multicolumn names, % allows to have multicolumn names
col sep=comma, % the seperator in our .csv file
display columns/0/.style={
column name=$Value 1$, % name of first column
column type={S},string type}, % use siunitx for formatting
display columns/1/.style={
column name=$Value 2$,
column type={S},string type},
every head row/.style={
before row={\toprule}, % have a rule at top
after row={
\si{\ampere} & \si{\volt}\\ % the units seperated by &
\midrule} % rule under units
},
every last row/.style={after row=\bottomrule}, % rule at bottom
]{table.csv} % filename/path to file
\end{center}
\end{table}
\end{document}
This will generate the following output:
This is a fairly long snippet just to include a table, but don’t worry, we can just reuse it and don’t have to code it every time again. We only have to change this part:
...
 display columns/0/.style={
		column name=$Value 1$,
		column type={S},string type},
      display columns/1/.style={
		column name=$Value 2$,
		column type={S},string type},
      every head row/.style={
		before row={\toprule},
		after row={
			\si{\ampere} & \si{\volt}\\
			\midrule}
			},
		every last row/.style={after row=\bottomrule},
    ]{table.csv} % filename/path to file
...
Adding new columns
The part that controls our column names and formatting is:
...
      display columns/1/.style={
		column name=$Value 2$,
		column type={S},string type},
...
The display columns/NUM/ lets us choose the name for a certain column. Note that numbering starts at zero. In order to add a new column, we simply copy the whole block and change the number to:
...
      display columns/2/.style={
		column name=$Value 3$,
		column type={S},string type},
...
That’s all we have to do. Well almost, we also have to add a new unit for this column, which happens here:…
...
		after row={
			\si{\ampere} & \si{\volt}\\
			\midrule}
			},
...
We just put a new ampersand & and use the siunitx package to choose a new unit like so:
...
		after row={
			\si{\ampere} & \si{\volt} & \si{\tesla}\\
			\midrule}
			},
...
In order for this to work, we must make sure that we export the .csv file in the correct format. It must have comma as the column seperator and newline as the row seperator. We can also change the respective seperators in our code above, but i recomment to use this layout to avoid problems. The raw .csv datafile for this example looks like:
The layout of a .csv file
column 1,column 2
1,2
11.432,2342.23123123
As you can see, the numbers contained are actually longer than what shows up in the table. This is because we have:
\sisetup{
  round-mode          = places, % Rounds numbers
  round-precision     = 2, % to 2 places
}
in the beginning of our document. Changing these values, will change all units formatted by siunitx automatically, which includes our table. It’s pretty straightforward to add a table, this snippet works for all tables, unless they are too long to fit on one page. For this purpose, I will introduce a new command in a different tutorial.
Summary
- LaTeX can generate tables from .csv files automatically
- Copy and paste the above snippet and packages to get it to work hassle free
- To add new columns, simply duplicate the display column line and change the number and name
- Add new units using the \siunitx command and the ampersand seperator as shown above
- Have a .csv file seperated with comma as column seperator and newline as row seperator
- Does only work for tables smaller than one page
Next Lesson: