Learn to create tables in LaTeX including all features such as multi row, multi column, multi page and landscape tables. All in one place.
- Your first table / table template
- Align numbers at decimal point
- Adding rows and columns
- Cells spanning multiple rows and multiple columns
- Prettier tables with booktabs
- Tables spanning multiple pages
- Landscape / sideways tables
- Tables from Excel (.csv) to LaTeX
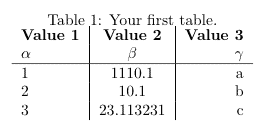
In this tutorial we’re going to learn how to use the table and tabular environments to create tables in LaTeX. At first we’re going to create a simple table like this:
After showing you how to modify this table according to your needs, I will also show you how to make your tables prettier and turn the table above into this:
Of course it’s up to your personal preference, but most of the time, I’ve found that the second table is much more readable and easier on the eye than the first table.
Afterwards I’m also going to show you, how to do some more elaborate things such as having rows and colums spend multiple cells as well as orienting tables sideways on the page (useful for tables with many columns) and how to have tables span multiple pages (useful for tables with many rows).
I’ve also created a tool to edit LaTeX tables right in your browser. This feature is still experimental, but if you want to try it, you can find it
Your first table
Tables in LaTeX can be created through a combination of the table environment and the tabular environment. The table environment part contains the caption and defines the float for our table, i.e. where in our document the table should be positioned and whether we want it to be displayed centered. The \caption and \label commands can be used in the same way as for pictures. The actual content of the table is contained within the tabular environment.
The tabular environment uses ampersands & as column seperators and newline symbols \\ as row seperators. The vertical lines separating the columns of our table (|) are passed as an argument to the tabular environment (e.g. \begin{tabular}{l|c|r} ) and the letters tell whether we want to align the content to the left (l), to the center (c) or to the right (r) for each column. There should be one letter for every column and a vertical line in between them or in front of them, if we want a vertical line to be shown in the table. Row seperators can be added with the \hline command.
Now let’s take a look at some actual code for a basic table, which you can easily copy-and-paste into your document and modify it to your needs.
\documentclass{article}

\begin{document}

\begin{table}[h!]
  \begin{center}
    \caption{Your first table.}
    \label{tab:table1}
    \begin{tabular}{l|c|r} % <-- Alignments: 1st column left, 2nd middle and 3rd right, with vertical lines in between
      \textbf{Value 1} & \textbf{Value 2} & \textbf{Value 3}\\
      $\alpha$ & $\beta$ & $\gamma$ \\
      \hline
      1 & 1110.1 & a\\
      2 & 10.1 & b\\
      3 & 23.113231 & c\\
    \end{tabular}
  \end{center}
\end{table}

\end{document}
The above code will print out the table which I’ve already shown you in the introduction and it looks like this:
While this table already works, it’s not very satisfying and readable that the numbers in the center column are not aligned at the decimal point. Fortunately, we don’t have to add spacing somehow manually, but we can use the siunitx package for this purpose.
Align numbers at decimal point
The first thing we have to do is to include the siunitx package in our preamble and use the command \sisetup to tell the package how many digital places it should display:
%...

\usepackage{siunitx} % Required for alignment

\sisetup{
  round-mode          = places, % Rounds numbers
  round-precision     = 2, % to 2 places
}

\begin{document}

%...
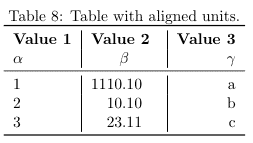
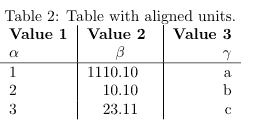
Afterwards we can use a new alignment setting in our tables, so besides left (l), center (c) and right (r), there’s now an additional setting S, which will align the numbers automatically. In our previous table, there was an alignment problem with the middle column, so I’ve now changed the alignment setting of the middle column from (c) to (S):
%...

\begin{table}[h!]
  \begin{center}
    \caption{Table with aligned units.}
    \label{tab:table1}
    \begin{tabular}{l|S|r} % <-- Changed to S here.
      \textbf{Value 1} & \textbf{Value 2} & \textbf{Value 3}\\
      $\alpha$ & $\beta$ & $\gamma$ \\
      \hline
      1 & 1110.1 & a\\
      2 & 10.1 & b\\
      3 & 23.113231 & c\\
    \end{tabular}
  \end{center}
\end{table}

%...
We can now observe, that LaTeX will now properly align the numbers at their decimal points and round the numbers to two decimal places:
Adding rows and columns
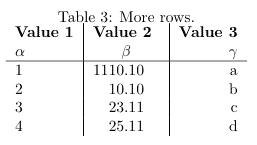
Now that we’ve setup our table properly, we can focus on adding more rows and columns. As I’ve mentioned before, LaTeX uses column separators (&) and row separators (\\) to layout the cells of our table. For the 5×3 table shown above we can count five times (\\) behind each row and two times (&) per row, separating the content of three columns.
If we now want to add an additional column, it’s as simple as copy and pasting the previous column and changing the contents. I will be reusing the table from above for this example and add an additional column:
%...

\begin{table}[h!]
  \begin{center}
    \caption{More rows.}
    \label{tab:table1}
    \begin{tabular}{l|S|r}
      \textbf{Value 1} & \textbf{Value 2} & \textbf{Value 3}\\
      $\alpha$ & $\beta$ & $\gamma$ \\
      \hline
      1 & 1110.1 & a\\
      2 & 10.1 & b\\
      3 & 23.113231 & c\\
      4 & 25.113231 & d\\ % <-- added row here
    \end{tabular}
  \end{center}
\end{table}

%...
This will generate the following output:
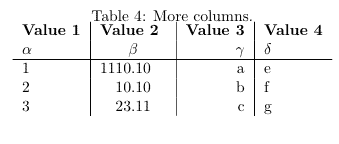
Adding an additional column is also possible, but you have to be careful, because you have to add a column separator (&) to every column:
%...

\begin{table}[h!]
  \begin{center}
    \caption{More columns.}
    \label{tab:table1}
    \begin{tabular}{l|S|r|l}
      \textbf{Value 1} & \textbf{Value 2} & \textbf{Value 3} & \textbf{Value 4}\\ % <-- added & and content for each column
      $\alpha$ & $\beta$ & $\gamma$ & $\delta$ \\ % <--
      \hline
      1 & 1110.1 & a & e\\ % <--
      2 & 10.1 & b & f\\ % <--
      3 & 23.113231 & c & g\\ % <--
    \end{tabular}
  \end{center}
\end{table}

%...
We will now see an additional column in our output:
Cells spanning multiple rows or multiple columns
Sometimes it’s necessary to make a row span several cells. For this purpose we can use the multirow package, so the first thing we’re going to do is adding the required package to our preamble:
%...

\usepackage{multirow} % Required for multirows

\begin{document}

%...
We can now use multirow and multicolumn environments, which allow us to conveniently span multiple rows or columns.
Using multirow
In order for a cell to span multiple rows, we have to use the multirow command. This command accepts three parameters:
\multirow{NUMBER_OF_ROWS}{WIDTH}{CONTENT}
I usually use an asterisk (*) as a parameter for the width, since this basically means, that the width should be determined automatically.
Because we’re combining two rows in our example, it’s necessary to omit the content of the same row in the following line. Let’s look at how the actual LaTeX code would look like:
%...

\begin{table}[h!]
  \begin{center}
    \caption{Multirow table.}
    \label{tab:table1}
    \begin{tabular}{l|S|r}
      \textbf{Value 1} & \textbf{Value 2} & \textbf{Value 3}\\
      $\alpha$ & $\beta$ & $\gamma$ \\
      \hline
      \multirow{2}{*}{12} & 1110.1 & a\\ % <-- Combining 2 rows with arbitrary with (*) and content 12
      & 10.1 & b\\ % <-- Content of first column omitted.
      \hline
      3 & 23.113231 & c\\
      4 & 25.113231 & d\\
    \end{tabular}
  \end{center}
\end{table}

%...
The modified table looks like this:
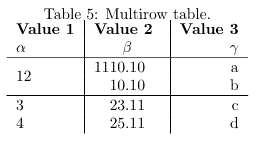
You can now see, that the cell containing 12 spans two rows.
Using multicolumn
If we want a cell to span multiple columns, we have to use the multicolumn command. The usage differs a bit from multirow command, since we also have to specifiy the alignment for our column. The command also requires three parameters:
\multicolumn{NUMBER_OF_COLUMNS}{ALIGNMENT}{CONTENT}
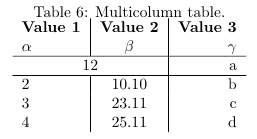
In our example, we will again combine two neighboring cells, note that in the row where we’re using multicolumn to span two columns, there’s only one column separator (&) (instead of two for all other rows):
%...

\begin{table}[h!]
  \begin{center}
    \caption{Multicolumn table.}
    \label{tab:table1}
    \begin{tabular}{l|S|r}
      \textbf{Value 1} & \textbf{Value 2} & \textbf{Value 3}\\
      $\alpha$ & $\beta$ & $\gamma$ \\
      \hline
      \multicolumn{2}{c|}{12} & a\\ % <-- Combining two cells with alignment c| and content 12.
      \hline
      2 & 10.1 & b\\
      3 & 23.113231 & c\\
      4 & 25.113231 & d\\
    \end{tabular}
  \end{center}
\end{table}

%...
This will result in the following content:
Combining multirow and multicolumn
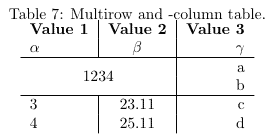
Of course it’s also possible to combine the two features, to make a cell spanning multiple rows and columns. To do this, we simply use the multicolumn command and instead of specifying content, we add a multirow command as the content. We then have to add another multicolumn statement for as many rows as we’re combining.
Because this is a little hard to explain, it will be much clearer when looking at the code. In this example, we’re going to combine two columns and two rows, so we’re getting a cell spanning a total of four cells:
%...

\begin{table}[h!]
  \begin{center}
    \caption{Multirow and -column table.}
    \label{tab:table1}
    \begin{tabular}{l|S|r}
      \textbf{Value 1} & \textbf{Value 2} & \textbf{Value 3}\\
      $\alpha$ & $\beta$ & $\gamma$ \\
      \hline
      \multicolumn{2}{c|}{\multirow{2}{*}{1234}} & a\\ % <-- Multicolumn spanning 2 columns, content multirow spanning two rows
      \multicolumn{2}{c|}{} & b\\ % <-- Multicolumn spanning 2 columns with empty content as placeholder
      \hline
      3 & 23.113231 & c\\
      4 & 25.113231 & d\\
    \end{tabular}
  \end{center}
\end{table}

%...
Our document will now contain a table, with a huge cell:
Prettier tables with booktabs
Of course beauty is always in the eye of the beholder, but I personally think, that the default hlines used by the table environment are not very pretty. For my tables, i always use the booktabs package, which provides much prettier horizontal separators and the usage is not harder compared to simply using hlines.
Again, we have to add the according booktabs package to our preamble:
%...

\usepackage{booktabs} % For prettier tables

\begin{document}

%...
We can now replace the hlines in our example table with toprule, midrule and bottomrule provided by the booktabs package:
%...

\begin{table}[h!]
  \begin{center}
    \caption{Table using booktabs.}
    \label{tab:table1}
    \begin{tabular}{l|S|r}
      \toprule % <-- Toprule here
      \textbf{Value 1} & \textbf{Value 2} & \textbf{Value 3}\\
      $\alpha$ & $\beta$ & $\gamma$ \\
      \midrule % <-- Midrule here
      1 & 1110.1 & a\\
      2 & 10.1 & b\\
      3 & 23.113231 & c\\
      \bottomrule % <-- Bottomrule here
    \end{tabular}
  \end{center}
\end{table}

%...
You can decide for yourself, if you prefer the hlines or the following output:
Multipage tables
If you have a lot of rows in your table, you will notice that by default, the table will be cropped at the bottom of the page, which is certainly not what you want. The package longtable provides a convenient way, to make tables span multiple pages. Of course we have to add the package to our preamble before we can start using it:
%...

\usepackage{longtable} % To display tables on several pages

\begin{document}

%...
It’s actually not harder, but easier to use than the previous code for tables. I will first show you what the code looks like and than explain the differences between longtable and tabular, in case they’re not obvious.
%...

\begin{longtable}[c]{l|S|r} % <-- Replaces \begin{table}, alignment must be specified here (no more tabular)
  \caption{Multipage table.}
  \label{tab:table1}\\
  \toprule
  \textbf{Value 1} & \textbf{Value 2} & \textbf{Value 3}\\
  $\alpha$ & $\beta$ & $\gamma$ \\
  \midrule
  \endfirsthead % <-- This denotes the end of the header, which will be shown on the first page only
  \toprule
  \textbf{Value 1} & \textbf{Value 2} & \textbf{Value 3}\\
  $\alpha$ & $\beta$ & $\gamma$ \\
  \midrule
  \endhead % <-- Everything between \endfirsthead and \endhead will be shown as a header on every page
  1 & 1110.1 & a\\
  2 & 10.1 & b\\
  % ...
  % ... Many rows in between
  % ...
  3 & 23.113231 & c\\
  \bottomrule
\end{longtable}

%...
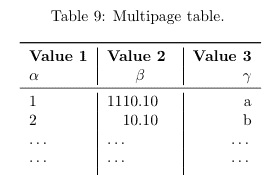
In the previous examples, we’ve always used the table and tabular environments. The longtable environment replaces both of them or rather combines both of them into a single environment. We now use \begin{longtable}[POSITION_ON_PAGE]{ALIGNMENT} as an environment for our tables. Using this environment, we create a table, that is automatically split between pages, if it has too many rows.
The content on the table on the first page looks like this:
Imagine that this table has many rows (…) being a placeholder for more rows and that the table continues the following page like this:
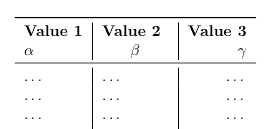
Note that there’s again a header on this page, but without the caption. This is because I’ve added the commands \endfirsthead and \endhead to my table, where everything written before \endfirsthead declares the header for the first page the table occurs on and everything between \endfirsthead and \endhead denotes the header, which should be repeated on every following page. If you don’t want a header on the following pages, you can simply remove everything in between \endfirsthead and \endhead including the \endhead command.
Landscape tables
Now that we have a solution for too many rows, we could also be facing the same problem if we had too many columns. If we add too many columns, we might be getting a table that’s too wide for the page. In this situation, it’s often best to simply rotate the table and print it in sideways. While there are many different ways to rotate the table, the only that I’ve found to be satisfying was using the rotating package.
First we include the required package in our preamble:
%...

\usepackage{rotating} % To display tables in landscape

\begin{document}

%...
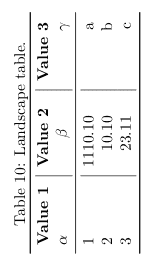
This package provides the sidewaystable environment, which is very easy to use. Just replace the table environment with the sidewaystable environment like this:
%...

\begin{sidewaystable}[h!] % <--
  \begin{center}
  \caption{Landscape table.}
  \label{tab:table1}
  \begin{tabular}{l|S|r}
  	\toprule
  	\textbf{Value 1} & \textbf{Value 2} & \textbf{Value 3}\\
  	$\alpha$ & $\beta$ & $\gamma$ \\
    \midrule
    1 & 1110.1 & a\\
    2 & 10.1 & b\\
    3 & 23.113231 & c\\
    \bottomrule
  \end{tabular}
  \end{center}
\end{sidewaystable}

%...
This will automatically rotate the table for us, so it can be read when flipping the page sideways:
Tables from Excel (.csv) to LaTeX
There are two disadvantages of writing tables by hand as described in this tutorial. While it works for small tables similar to the one in our example, it can take a long time to enter a large amount of data by hand. Most of the time the data will be collected in form of a spreadsheet and we don’t want to enter the data twice. Furthermore once put into LaTeX tables, the data can not be plotted anymore and is not in a useful form in general. For this reason, the
Summary
- LaTeX offers the table and tabular environment for table creation
- The table environment acts like a wrapper for the tabular similar to the figure environment
- Alignment and vertical separators are passed as an argument to the tabular environment (e.g. \begin{tabular}{l|c||r})
- It’s possible to align the content left (l), centered (c) and right (r), where the number of alignment operators has to match the desired number of columns
- The columns can be seperated by adding | in between the alignment operators
- Rows can be seperated using the \hline command and columns using the ampersand & symbol
- The newline \\ operator indicates the end of a row
- It’s possible to refer to tables using \ref and \label
- Align numbers at the decimal point using the siunitx package
- Combine multiple rows and columns with the multirow package
- Prettify your tables using the booktabs package
- Make your tables span multiple pages with the longtable package
- Display your tables in landscape using the rotating package
Next Lesson: